One of the most important and valuable tool that Photoshop gives you to edit or recover images is histograms. Histograms are, in fact, very valuable and not only limited in Photoshop. You’ll find them in many other photo editing programs such as Photoshop Elements, Adobe Lightroom, Camera Raw plug-in, and much more! Quite a few digital cameras nowadays have the convenient histogram function allowingyou to see the brightness of details in the photos you’ve justtaken(it’s very important to your photo)! Despite its simplicity, it’s really hard to imagine a life without histograms, at least to those who think image quality does matter.
Maybe you are wondering what a histogram is. Simply, a histogram is a graph. I know some of you will fall asleep when I’ve just mentioned the word “graph”. But don’t worry, this is just an easy tool. A histogram is a graph that helps us see the current brightness of the photo. A histogram lets us see how many percentages of the photo are virtually black, how many for white and how many for grey. “Black and white” here does not mean black and white photo. The histogram displays exactly the photo with all colors, as you’re looking at the brightness but not the colors (although histograms can be used to see the brightness of each specific color, you need not know about it this time).
Why should we know about the brightness of the photo? Have you ever looked at a photo that seems ‘flat’? It can be a very nice photo generally, but it’s not as striking as you wish. Maybe it’s because the photo has low contrastand you can open its histogram to find out improper areas. Histograms instantly let you see some prominent points in a photo that is not shiny white enough or lack of black in the dark ,which may lead to low contrast of the photo. They help find ỉm-proper details quickly, avoid waste of time wondering why the photo is not striking enough.
Another problem may arise in photo editing, that is, some part of the photo may be too dark and become totally black, and/or another is too bright and become totally white, in whichever case you will lose all image details in that too bright or too dark area. Since our eyes are not sensitive enough, it’s actually not always easy for us to detect these problems by just looking at the screen. But with only a glance at the histogram, you can find out if the editing has gone too far and it’s time to come back a little bit. Or else, if you need to recover an old photo, its histogram can tell you if the original image loses details in the bright or dark area. The point is, it’s disadvantageous to you and your photo if you’re editing the photo but do not know how to read a histogram.
Look at a histogram in Photoshop
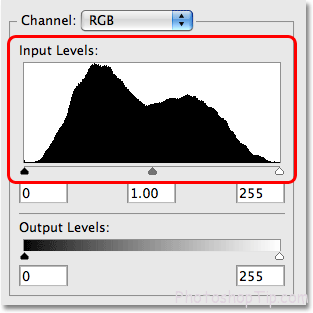
The most popular way to see a histogram in Photoshop is in the box Levels. Although Adobe introduces histogram in Photoshop CS and even add a histogram in box Curves inPhotoshop CS3, Levels helps you find histograms more easily and accurately. You can find below an example of a typical histogram. The histogram is the black area like a mountain:
The histogram is the black ‘mountain’ in the center of the box Levels.
The reason why Levels helps you see histograms better is, Levels has a gradient bar lying horizontally right below the histogram. Gradient starts from virtual black color at the far left and gradually brighter until it gets virtually white at the far right:
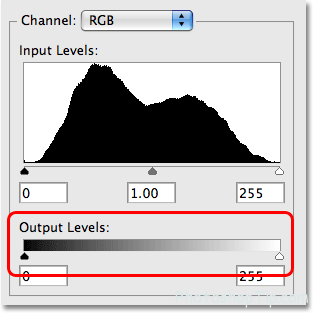
Box Levels contains black color and the white gradient bar below the histogram.
Why does gradient bar help you read histograms easily? Because the brightness of gradient suitswith the histogram beyond. The histogram shows ranges of colors of the photo that are distributed by and between virtual black and virtual white colors. The height of the ‘mountain’ within a brightness level of gradient shows the density of photo details there. The low area of the ‘mountain’ within a brightness level in gradient tells few details are display there. If the ‘mountain’ does not have height at a certain level of brightness, it means there are no details there in your photo.
For instance, have a look at the left side of the histogram, and you’ll see a very little part of the ‘mountain’ displayed. That area at the far left shows black color of the photo. Looking closely, you’ll find that those areas at the left side correspond vertically to the virtual black color in the gradient below. Since there are few histograms there, we know black area in your photo is very small:
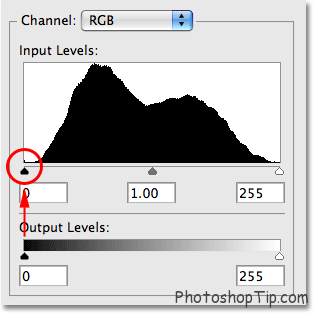
The upper left area of the histogram shows how much of our image is currently black.
If we have a look at the right side, we hardly see any details here. The right-side areas displays virtually white color, and we once again can see this in box Levels as the line goes vertically with the virtually while color in the gradient below. And only a small strip of the gradient appears on the right side.
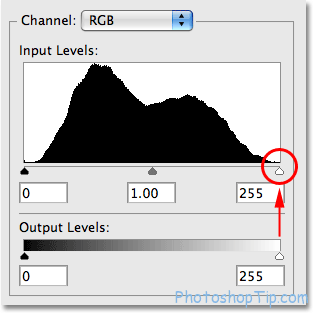
The upper right areas of the histogram let us know how much of the photo is currently virtually white.
Your photo may have little virtual white or black colors, but you can see steep ‘mountain’ slopes in other between-black-and-white areas, which means you have much image information there. Again, if we compare ‘mountain peaks’ in the histogram with the brightness of the gradient below, we know exactly the bright areas in the photo currently are:
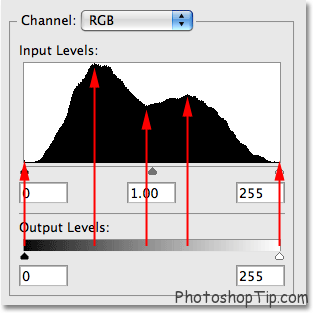
The histogram shows much image information spread by and between back and white.
No need to look at the photo you are opening, you just take a look at its histogram and know many details of this photo are spread evenly within the scope of the brightness levels and the ‘mountain’ height at the upper left or right is not much. Then you’ll know you do not lose any details. In order to compare, see below example of a histogram from a shadow-cut photo. The height of the ‘mountain’ goes up at the far left with a direct black peak in the gradient below. This is an example for the case in which image details in the dark are lost.
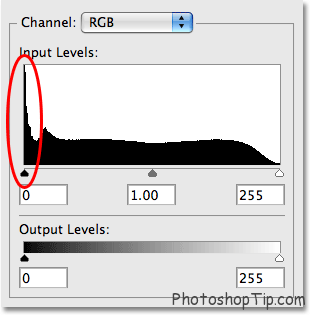
Above picture shows the histogram of image details for the upper left, in which often means details of the shadow are lost.
You will not have to care about editing photos here. Just look at the histogram, learn to understand what it tells you about your photo. Below is another example on a histogram contrary to the previous. In this histogram, brightness points are cut, meant you’re losing details in bright points.

A histogram with much information on the right side often means prominent details in the photo are lost.
Without histograms, you are likely not to realize some details in the dark or light are missing. But with histograms, they help you while you’re working and keep you informed of potential issues while editing photos, like Photoshop.
Then, look closer at the histogram and ask yourself if there is any ‘ideal’ or ‘perfect’ histogram.
256 levels for brightness
Look at the direct lower left or right of the histogram in box Levels, and you’ll see a number, “0” at the left and “255” at the right. Histograms offer exactly 256 different levels of brightness from black to white, with “0” is virtually black and 255 is virtually white. And it’s because 8-bit image standard contains at most 256 brightness values (photo saved under JPEG files, for instance, is an 8-bit photo). The reason why the number goes from 0 to 255 but not from 1 to 256 is that, people often count from 1 whereas computers (and computer programs like Photoshop) start counting from 0:
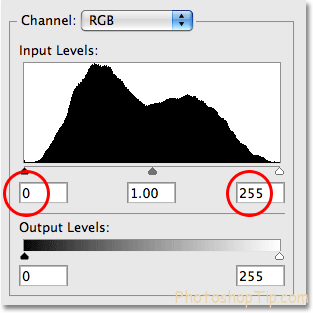
Above histogram displays 256 levels of brightness, with 0 for virtual black color and 255 for virtual white.
If you look closely at the upper part of the histogram vertically, you’ll find it uneven but formed into small thorns and each thorn is head of a thin black vertical bar. If you count, there are exactly 256 vertical black bars vertically in total, each of which displays a specific brightness level. Below is a minimization of the histogram view to make it easier to see the heads:

“Mountains” of a histogram really contain (up to) 256 individual vertical bars.
Remember there is not a 1:1 ratio between the histogram and the actual number of pixelsin a photo. Digital photos nowadays a made from millions of pixels. And if Adobe managed to be compatible to all photos in histograms, you’ll need some monitors just to watch them. So histograms simple help us with a general idea on the brightness of the photo.
The fiction of a perfect histogram
Many people ask if there is an ideal or perfect histogram. The answer is no, in fact. Photos are different, meant all histograms are different. There is no ideal shape for a histogram that you have to reach for. Paying too much attention to histograms will actually be a big mistake. Histograms should be used as a guideline, but not a target. The most important is the photo itself. Histograms simple lets you know what you are working with and what you can do to complete (lack of brightness, too much excess of brightness, etc…) And if pay enough attention to the histogram while editing, you can make sure you do not go too far and lose details in your photo. You should always focus on the beauty of the photo based on what the photo says, not what the histogram says.
As an example on different methods, histograms can be later photos. See below photo:
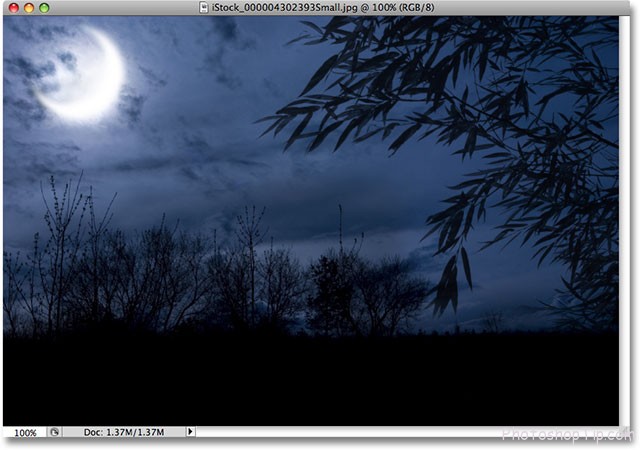
An example on a natural dark photo
A photo on natural dark like above, is dark or at least darker than an average photo you take in the middle of the afternoon. Below is what the histogram for this photo looks like:

The histogram shows that most photos are made of dark colors.
The most prominent point of the histogram lies at the left half of the brightness levels, which means most of the photo are dark and there are quite few details in the bright part. Such photos are often called low-key as they are naturally dark. Actually in this case, a great part in the upper left side of the histogram shows a great black area of the photo. Now you know too much of black colors is a problem as it means the photo loses some details in the dark. But for almost everything in life, there are exceptions, irregularities. In this photo, the foresight at the front is a silhouette shooting in the moonlight, therefore the black color creates natural beauty to the photo despite too much dark. It’ll be a mistake if you try“fixing” the photo just to make the histogram more ‘standard’.
Below is another example:
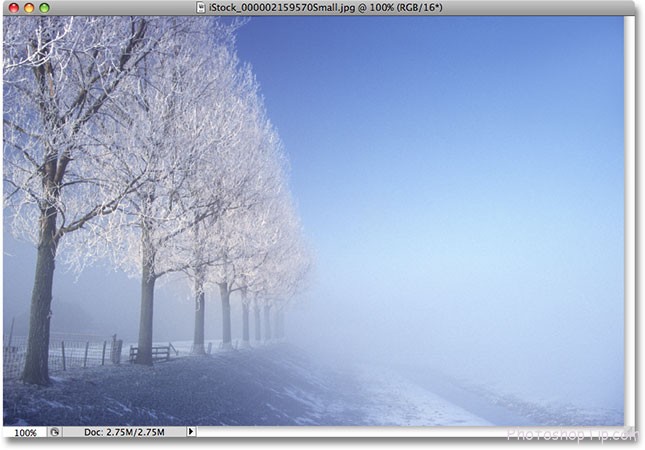
An example on natural light.
This winter scenery is contrary to the previous photo. Everything is bright with quite few dark areas found in this photo. This is the overall histogram:
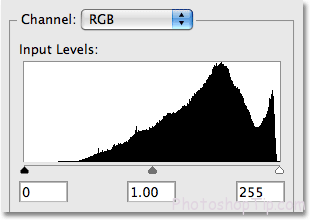
This histogram shows that the photo is quite bright
In this case, you can see most of the histogram lies in the right half of the brightness levels, telling you there is quite little dark in the photo. Actually there is not any real black color nor any black-like colors in this photo. Such photos are called high-key because it’s naturally bright. Once again, it’ll be a mistake if you edit the photo simply just to balance the histogram, as the real photo will be afftected.
When you know how to read a histogram in Photoshop as anecessaryskill to edit photos professionally, I think it’ll be useful for you to have deeper and accurate view on your photos. Whether you look at histogram in LCD screen of your digital camera, or use histogram to adjust exposure in Camera Raw, fix general issues of darkness and brightness with Levels, adjust photo contrast with Curves, or simply glance at the histogram while editing, this will help you with a better concept at that time to edit the photo better. If you take a photo, its histogram will help you adjust darkness and brightness in the photo while shooting, and you’ll have standard bright-metering photos. If you only look at LCD screen in the camera when it’s too bright or too dark, the screen will deceive your eyes. Just a simple histogram, it’s important to understand it.

